
Cross Stitch Symbols and Chart Keys Explained
A cross stitch chart is a grid full of small marks. Once you know the conventions, almost any chart from any designer becomes readable, because the vocabulary is remarkably consistent across the hobby.
Why symbols instead of colour
It seems backwards at first. Why not just print the colours?
Three reasons, and they all hold up:
Similar shades are indistinguishable in print. A design might use four greys that differ subtly. Printed as colour blocks they merge into one another, particularly under a lamp in the evening. As distinct symbols they stay separate no matter what the light is doing.
Printers lie. The blue on your screen is not the blue from your printer, and neither is the blue on the thread. A symbol is a symbol on any device.
Symbols work in black and white. Which matters when you print sixteen pages of a large chart.
Most modern charts give you both: a coloured square with a symbol on top. That is the best of both, and it is worth choosing that view if your software offers it.
Reading the key
The key, sometimes called the legend or the floss list, is the translation table. A typical row contains:
- The symbol as it appears on the grid
- The thread number, usually DMC unless stated otherwise
- The colour name, such as "Very Dark Baby Blue"
- A colour swatch
- The stitch count for that shade, sometimes with an estimate of skeins needed
The stitch count column is more useful than it looks. It tells you which colours dominate, so you know which to buy two skeins of, and it flags shades used only a handful of times that you might reasonably substitute or drop.
If the chart lists more than one brand, the columns usually run DMC first with alternatives beside it. Our guide to converting between brands covers what to watch for when substituting.
What the different marks mean
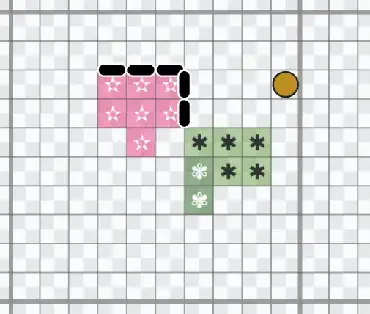
In the extract above: each symbol inside a square names the thread for that square, so the pink and the green blocks are two different colours. The heavy line running along the cell edges is backstitch, and the filled circle on its own is a French knot.
A symbol in a square is a full cross stitch in that colour. This is the bulk of any chart.
A symbol in part of a square, often a triangle or a symbol pushed into one corner, is a fractional stitch. Quarter, half and three-quarter stitches let a design describe a curve rather than a staircase. There is a full explanation in fractional stitches explained.
A line along the edges of squares is backstitch. It is drawn on the grid lines rather than inside a square because that is where it is worked, which is what lets it outline shapes at a finer scale than the stitches themselves. Backstitch lines are usually printed in a heavier weight, and the key lists their colour separately. See what is backstitch.
A filled dot or small circle is a French knot.
An elongated oval is usually a bead, though conventions vary and the key should say.
A long straight line crossing several squares may be a long stitch or a straight stitch, distinct from backstitch.
The grid itself
Heavy lines every ten squares. Almost universal, and the single most useful feature of any chart. Counting in tens is far more reliable than counting in ones, and it matches gridding your fabric in tens with a water-soluble pen.
Arrows or markers at the centre. These mark the middle of the design on each axis. Finding the centre of your fabric and the centre of the chart, and starting there, is the standard advice for a reason: it guarantees the design ends up centred.
Row and column numbers along the edges. On a multi-page chart these are essential for working out which page you are on and where the overlaps are.
Symbols that catch people out
A few practical warnings.
Similar symbols in the same design. A plus and a cross, or an open circle and a filled one, are easy to confuse late in the evening. If your software lets you reassign symbols, spreading the confusable ones apart is worth doing before you start.
Very light shades on a white background. A pale yellow square with a pale symbol can be nearly invisible on screen. Switching to symbol-only view usually solves it.
Backstitch hidden under stitches. On a colour chart, backstitch lines can disappear against dark blocks. Most software lets you toggle backstitch on its own, which is worth doing before you start the outlining.
Working from a chart on screen
Reading a chart digitally solves several of these problems at once. You can zoom in when the symbols get dense, switch between colour, symbol and combined views, isolate one colour at a time, and mark off what you have done so you never lose your place.
If you want to see how that compares to a printout, printing a cross stitch pattern, or going paperless weighs both. And if you are new to charts generally, how to read a cross stitch pattern is the place to start.
The good news
The conventions really are consistent. Learn to read one chart properly and you can read almost any chart, from any designer, in any language. The key is a translation table, the grid counts in tens, lines are backstitch and dots are knots.
You can browse the pattern library to see charts with symbols and keys, or see all the tools if you want to work from a chart on screen.